HOW TO READ
ELECTROPHORETIC PATTERN OF SERUM PROTEINS
A CLEAR AND SIMPLE METHOD
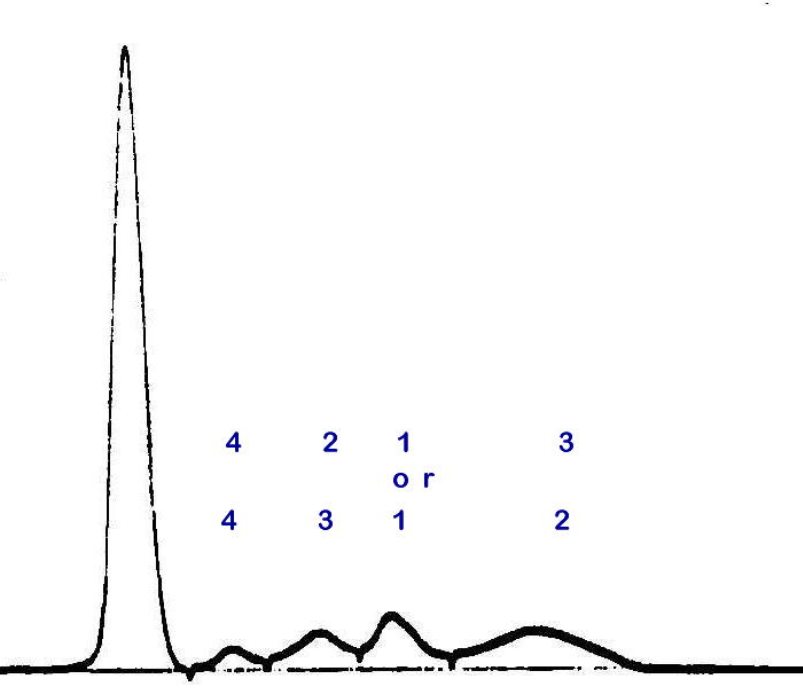
Fig. 1: Normal pattern
(The order of the height of the globulin peaks is much more easily detectable finding at a glance, when compared with the measurement of the area of each globulin fraction.)
The electrophoresis of serum proteins is one of very informative clinical examinations. So far, since the diagnostic evidence obtained from this test has been considered to be insufficient, significance and usefulness of the examination has been underestimated.
However, if we read the electrophoretic patterns properly, like the way I proposed here, this examination must be one of the very important clues to diagnosing various clinical conditions.
Simply read the level difference of each peak which are made by protein fractions. This is a simple method I propose here.
The densitometric tracing pattern of serum electrophoresis is composed of five main groups which make individual peaks. These are albumin peak and four globulin peaks: alpha-1, alpha-2, beta, and gamma globulins.
In normal individuals in electrophoretic pattern, beside albumin peak, beta gllobulin peak makes highest peak, and alpha-2 or gamma globulin, second highest, and alpha-1 globulin makes the lowest peak, as shown in Fig.1.
This pattern is confirmed to be normal by the pattern from many electrophoretic samples (over 1,000) gained in seven representative laboratories in Japan.
Only compare the height of each globulin in practical use.
Fist of all, if you see the peak of alpha-2 globulin fraction is higher than that of beta globulin fraction as seen in Fig 2, the change can indicate at least any one of the following:
(1) inflammatory processes of all types, including infection, malignancies, collagen diseases, and myocardial infarction, etc. or
(2) hyperlipidemia especially one that is caused by nephrosis.
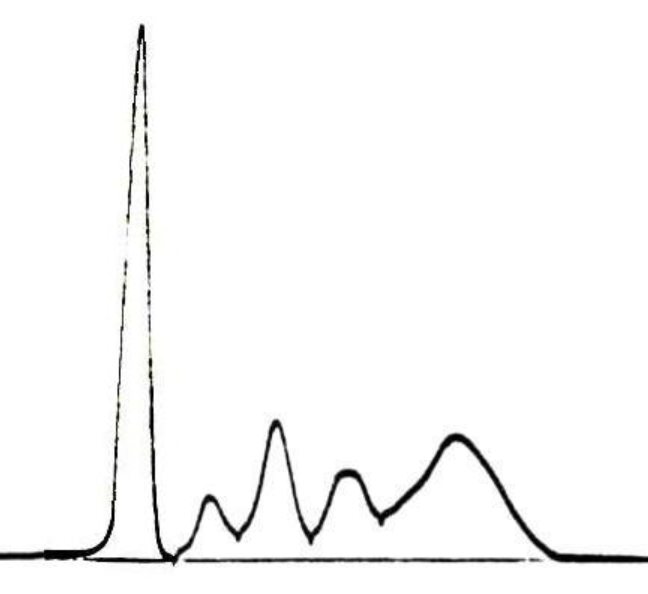
Figure 2. Chronic Inflammation
Secondly, if you see the peak of gamma globulin fraction is higher than that of beta globulin, this change may indicate
(1) chronic diseases of various types, including liver diseases, collagen diseases, malignancies, chronic infections or noninfectious inflammatory bowel diseases, etc. or
(2) M-components.
Additionally, if alpha-2 globulin fraction peak is lower than alpha-1 globulin peak, the finding may indicate the presence of any hemolytic processes in the body, including leukemias, hemolytic anemia, hematoma, and disseminated intravascular coagulation (DIC)(Fig 3), etc.
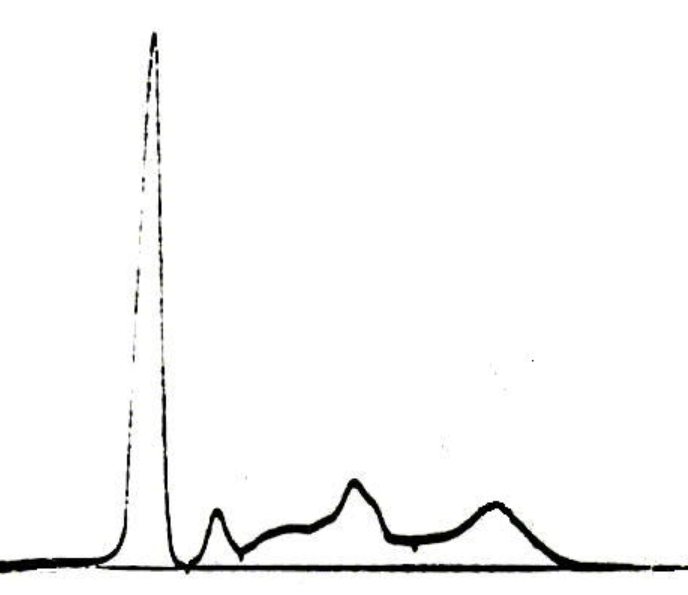
Figure 3. Hemolysis (DIC)
In the patient who has already been made a clinical diagnosis of the disease, the changes in the serial electrophoretic patterns will provide us with very useful and helpful information about the changes of the patient condition during the course of the disease.
REFERENCE: Inoue T. One point advises 500 for daily clinical practices pp 252, 1993 Bunkodo, Tokyo. (In Japanese)
・・・・・・・♪♪♪・・・・・・・
FURTHER INFORMATIONS
Among all about 30,000 different kind of serum proteins, only a few major parts have qualified to change the data of serum electrophoresis. These proteins are shown in Figure 4 and Table 2.
About 90 percent of "albumin" fraction is consisted of albumin (as the substance). The greater part of alpha-1 acid glycoprotein (α1-AGP) is located in albumin fraction.
Alpha-1 antitripsin (α1-AT) is the main component of alpha-1 globulin fraction, while only cathodic ends of α1-AGP, and alpha-1 lipoprotein (α1-LP) are situated in this fraction.
Alpha-2 globulin have two major components, including haptoglobin (Hp) and alpha-2 macroglobulin (α2-M). In normal subjects, the summit of this globulin fraction is built of HP, while α2-M is laid as the foundation of this fraction.
Beta globulin peak is made by transferrin (Tf). while 3rd component of complement (C3) also is another major component of the fraction. In addition, the cathodic ends of α2-M/beta lipoprotein (β-Lp), and the anodic ends of all three immunoglobulins (IgG, IgA, and IgM) are usually present here with the total protein concentration beyond 100 mg/dL.
Gamma globulin fraction is consisted of all three classes of immunoglobulins. Usually, the summit of the fraction is built of IgG.
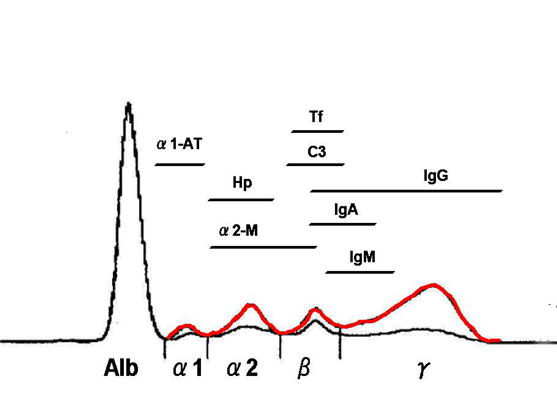
Figure 4. Sample tracing (chronic inflammation): 58 year-old woman with anti-SS-A/Ro antibody-positive vasculitis.
Her CRP was 5.5 mg/dL. Increases in α1-AT, Hp, ceruloplasmin (Cp) and IgG are seen (Table 1 and 2.).
(red = patient, black = normal)
Table 1.
|
|
TP |
Alb |
alpha-1 |
alpha-2 |
beta |
gamma (g/dL) |
|
This case |
8.4 |
3.7 |
0.28 |
0.93 |
0.73 |
2.8 |
|
Reference Range |
6.4-7.8 |
4.2-4.7 |
0.10-0.28 |
0.23-0.53 |
0.42-0.79 |
0.88-1.58 |
Table 2.
|
|
α1-AGP |
α1-AT |
Hp |
α2-M |
Cp |
Tf |
C3 |
IgG |
IgA |
IgM (g/dL) |
|
This case |
212 |
213 |
312 |
211 |
44.5 |
161 |
133 |
3370 |
414 |
85 |
|
Reference Range |
30-85 |
170-274 |
19-170 |
130-250 |
21-37 |
200-340 |
86-160 |
870-1700 |
110-410 |
46-260 |
Normal values; (Osaka City University Hospital)
Takatoshi INOUE, M.D. 2007/01/15, 2007/01/28 (English revised by Dr. Katsuhisa YAMAGAMI, M.D.)